Your Search Console Data Has Been Wrong for a Year

Google Confirmed a Logging Bug Inflating Impressions Since May 2025. We Analyzed 17 Properties Across Industries to Measure the Damage
Passionfruit Labs | April 2026
On April 3, 2026, Google quietly updated its Data Anomalies page with a statement that should alarm every marketing leader who has used Search Console data to make decisions in the past year:
"A logging error is preventing Search Console from accurately reporting impressions from May 13, 2025 onward. This issue will be resolved over the next few weeks; as a result, you may notice a decrease in impressions in the Search Console Performance report. Clicks and other metrics were not affected by the error, and this issue affected data logging only."
That is nearly eleven months of inflated impression data in the single most widely used organic search measurement tool in the world. Every impression-based KPI, every CTR calculation, every visibility trend line, and every board report built on Google Search Console impressions during this period was based on corrupted numbers.
Google did not disclose the magnitude of the inflation. They did not explain the mechanism. They did not address whether the bug interacted with other known data issues from the same period.
So we did.
We analyzed 12 months of Search Console performance data across 17 properties spanning B2B SaaS, eCommerce, media, and professional services ranging from 17,000 to 5.55 million annual clicks. What we found is that this is not a single bug. It is the third major data integrity failure to hit Search Console in under twelve months, and the three compound into a measurement crisis that has gone largely unaddressed.
The Three Overlapping Problems
Before examining our data, it is important to understand that the logging bug Google acknowledged on April 3 is not the only issue affecting Search Console data quality over the past year. There are three overlapping problems, and each one distorts the data in a different way.
Problem 1: The logging bug (May 2025 to present)
Google confirmed that a logging error has been inflating impression counts in the Performance report since May 13, 2025. Clicks were not affected. The fix is rolling out over several weeks starting in early April 2026.
This means every impression number reported by Search Console for the past eleven months was higher than reality. Every CTR calculated from those numbers was lower than reality (because CTR = clicks / impressions, and the denominator was inflated). Every trend analysis showing "growing impressions" during this period may have been partially or entirely measuring the growing bug, not growing visibility.
Google did not quantify the inflation. Our data provides the first published estimate.
Problem 2: The scraper inflation and &num=100 kill (September 2025)
On September 12, 2025, Google deprecated the &num=100 parameter, which had allowed search queries to return 100 results per page instead of 10. SEO rank-tracking tools were heavily using this parameter. Every time a scraper loaded 100 results, every URL on that page received an impression in Search Console, even though no human ever saw them.
When Google killed the parameter, impressions collapsed across the industry overnight. Practitioners reported 20-40% drops in a single day. One site documented a loss of 200,000 daily desktop impressions. The divergence between impressions and clicks, which the industry had called the "Alligator Effect" (impressions steadily rising while clicks stayed flat), snapped shut immediately.
What many in the industry initially attributed to AI Overviews increasing zero-click searches turned out to be bot-driven impression inflation. The narrative that "AI search is eating our clicks" was, in part, a measurement artifact.
This event partially masked the logging bug. Impressions dropped in September (scrapers removed) but did not drop to pre-May levels (because the logging bug was still active underneath). The two inflations were running simultaneously from May through September 2025.
Problem 3: AI Mode data merged without segmentation (June 2025)
On June 17, 2025, Google began counting AI Mode clicks, impressions, and position data toward totals in the Search Console Performance report. AI Mode data was merged into the existing "Web" search type with no dedicated filter to separate it from traditional organic results, featured snippets, or AI Overviews.
As of April 2026, there is still no native filter in Search Console to separate AI Mode data. This means 10-blue-links data, featured snippet data, AI Overview data, and AI Mode data are all blended together under "Web." Position data is calculated differently for each surface type. Follow-up questions in AI Mode reset positions to 1. AI Mode now reaches 75 million daily users.
Glenn Gabe, an independent SEO consultant, summarized the situation: "We now have the 10-blue links, featured snippets, AIOs, and now AI Mode all grouped together in the performance reporting under Web Search. Good luck trying to figure this out in GSC."
The compound effect
Any impression trend line spanning mid-2025 to mid-2026 now contains at least five significant discontinuities:
May 13, 2025: Logging bug begins inflating impressions (invisible to users at the time)
June 17, 2025: AI Mode data merged into Search Console totals (new data stream, no filter)
September 12, 2025: &num=100 parameter killed (sudden impression drop from scraper removal)
Late March 2026: Merchant listings and Google Images impression spikes flagged by practitioners
April 3, 2026: Google acknowledges the bug; fix begins rolling out
Plus two additional documented anomalies: a data freeze across all properties on October 19, 2025, and two days of missing bulk export data on February 28 and March 1, 2026, which Google confirmed will not be recovered.
Year-over-year comparisons using impression data from this period are not meaningful.
What We Found Across 17 Properties
We examined 12 months of Search Console performance data (April 2025 through March 2026) across 17 properties spanning B2B SaaS, eCommerce, media, and professional services. The properties range in scale from 17,000 to 5.55 million annual clicks and from 2.52 million to 292 million annual impressions. All properties use the "Web" search type filter. Data was captured in early April 2026, before the fix had fully propagated.
The properties are anonymized. We refer to them as Property A through Property Q.
Finding 1: Impression-click divergence is universal across the portfolio
Every single one of the 17 properties shows impressions growing faster than clicks during the post-May 2025 period. This is the most fundamental indicator of inflation: organic visibility growth that is real produces proportional click growth. When impressions grow 2x to 3x and clicks remain flat or grow modestly, the impressions are not measuring real human visibility.
Property | 12-month clicks | 12-month impressions | CTR | What the chart shows |
|---|---|---|---|---|
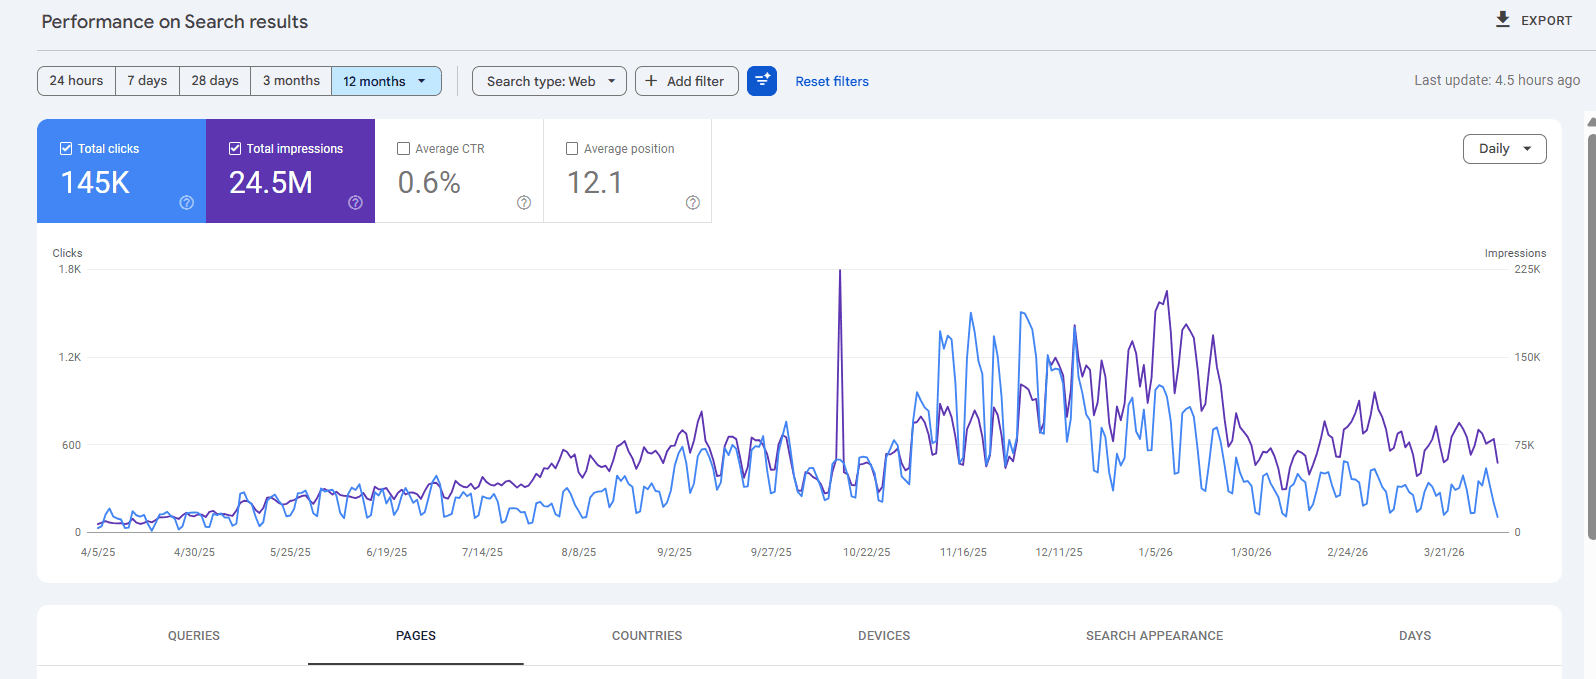
A | 145K | 24.5M | 0.6% | Impressions spike ~Oct 2025 to 2-3x pre-May levels. Clicks flat throughout. |
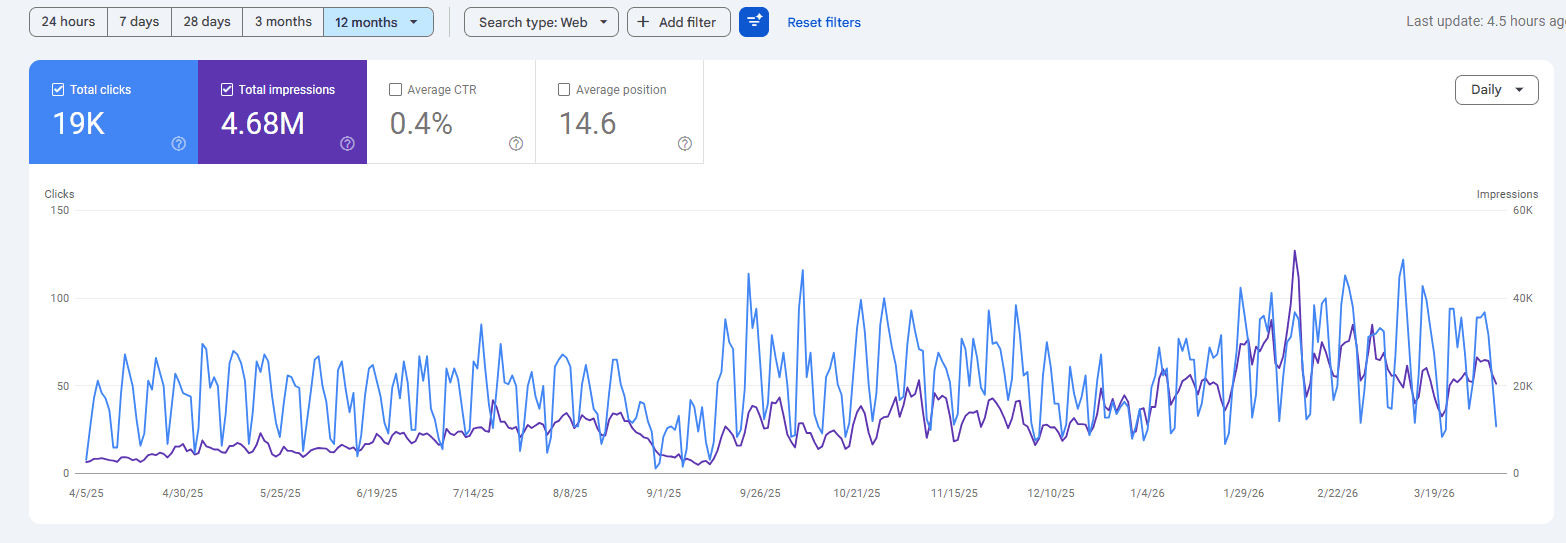
B | 19K | 4.68M | 0.4% | Impressions jump sharply ~Sep 2025, stay elevated. Clicks completely flat. |
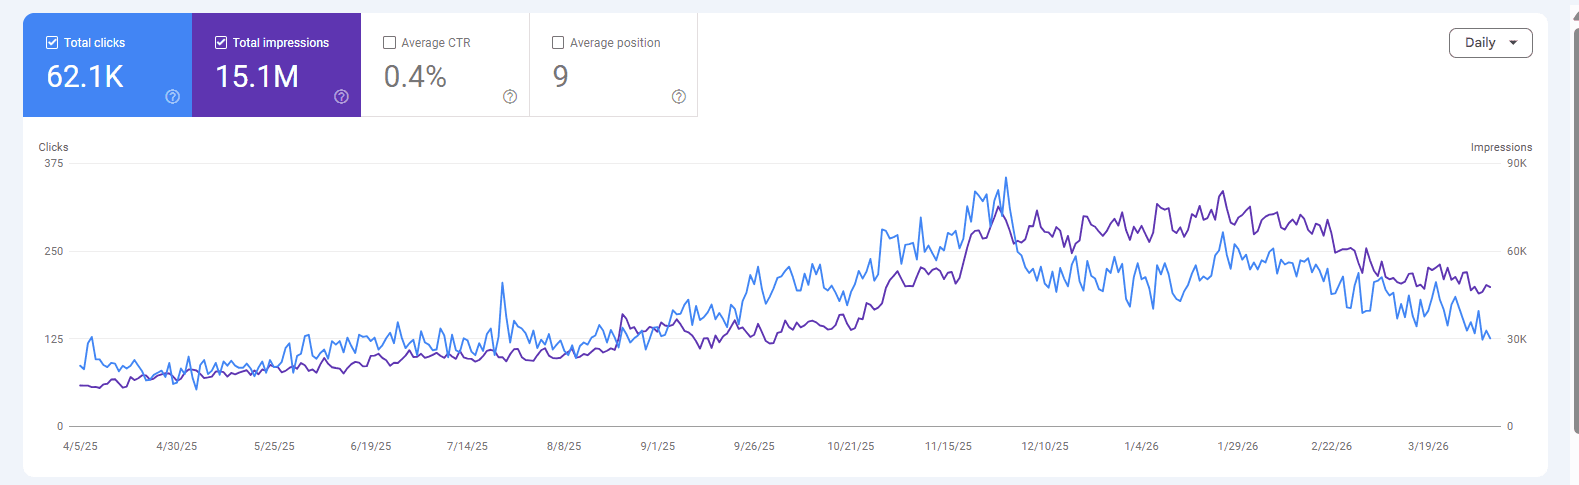
C | 62.1K | 15.1M | 0.4% | Strongest divergence in first set. Impressions roughly 3x Oct-Dec vs. pre-May. Sharp drop late Feb. |
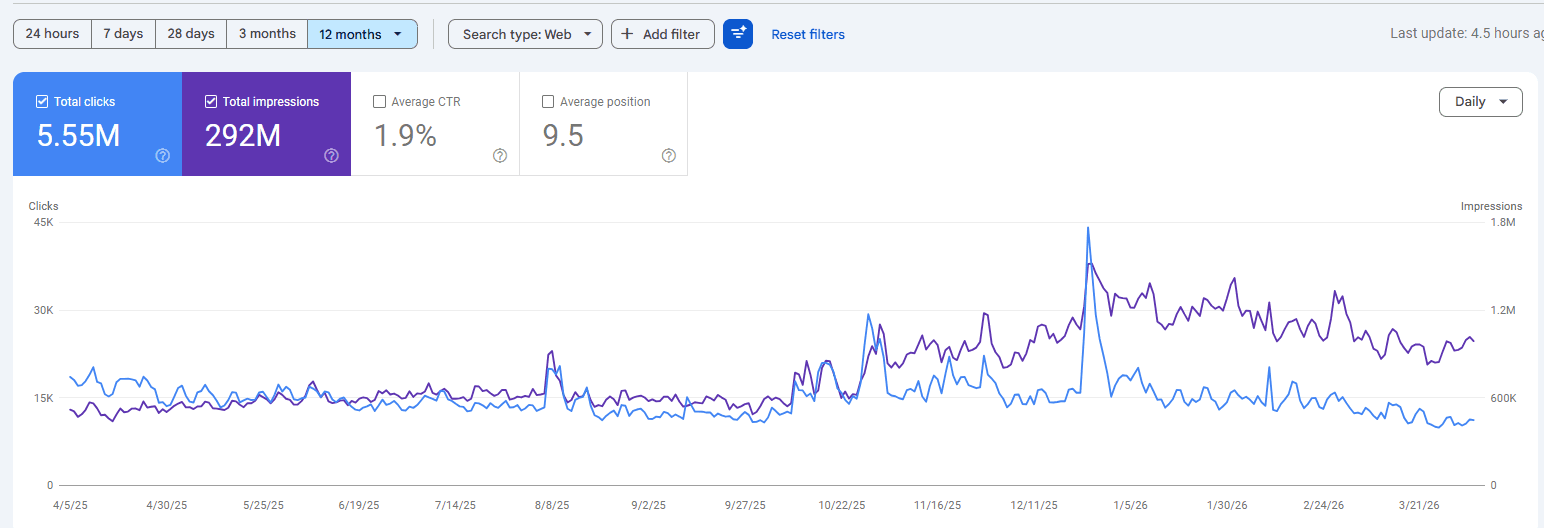
D | 5.55M | 292M | 1.9% | Largest property. Massive impression spike ~Dec 2025 (1.8M daily). Clicks stable ~15K daily. |
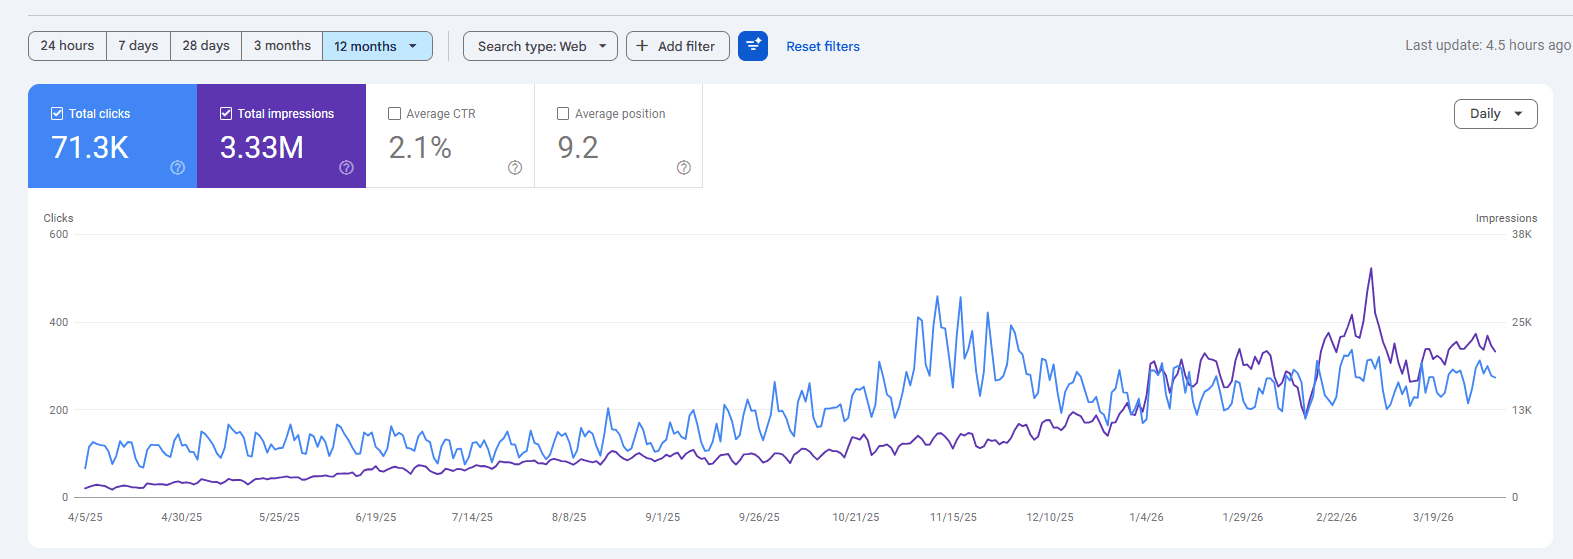
E | 71.3K | 3.33M | 2.1% | Both metrics trend up, but impression spike ~Feb-Mar 2026 outpaces clicks. |
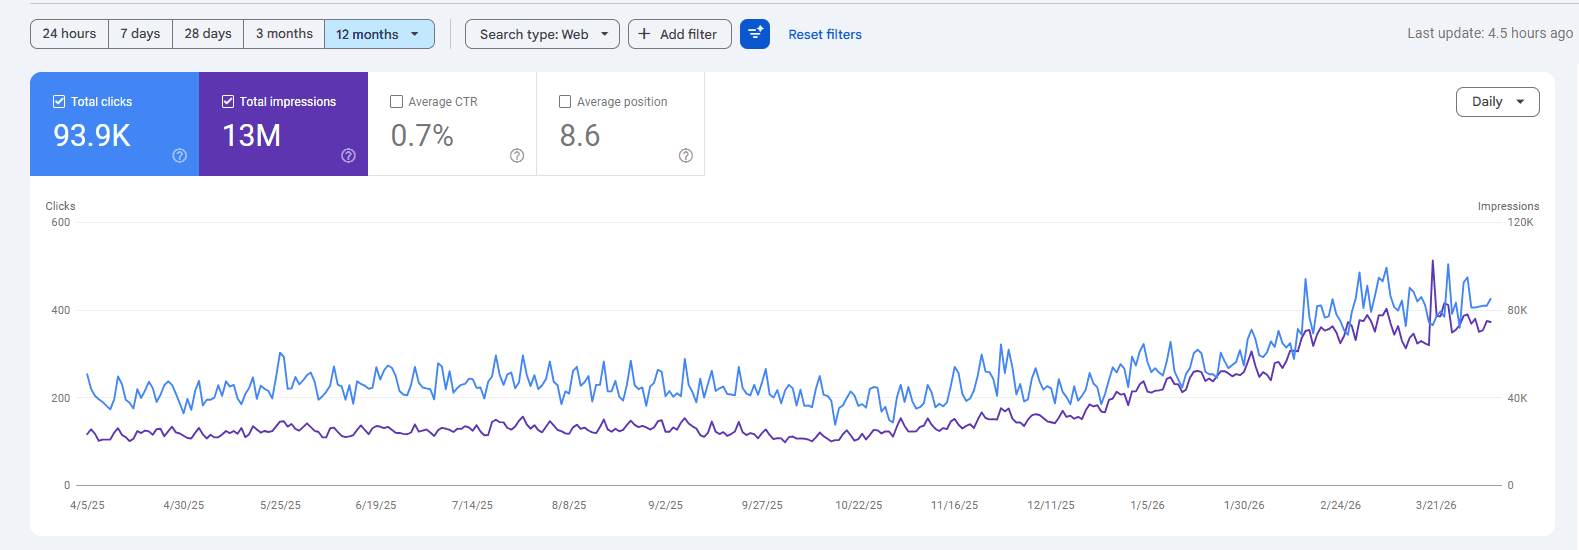
F | 93.9K | 13M | 0.7% | Impressions flat until ~Feb 2026, then sharp spike. Clicks growing steadily throughout. |
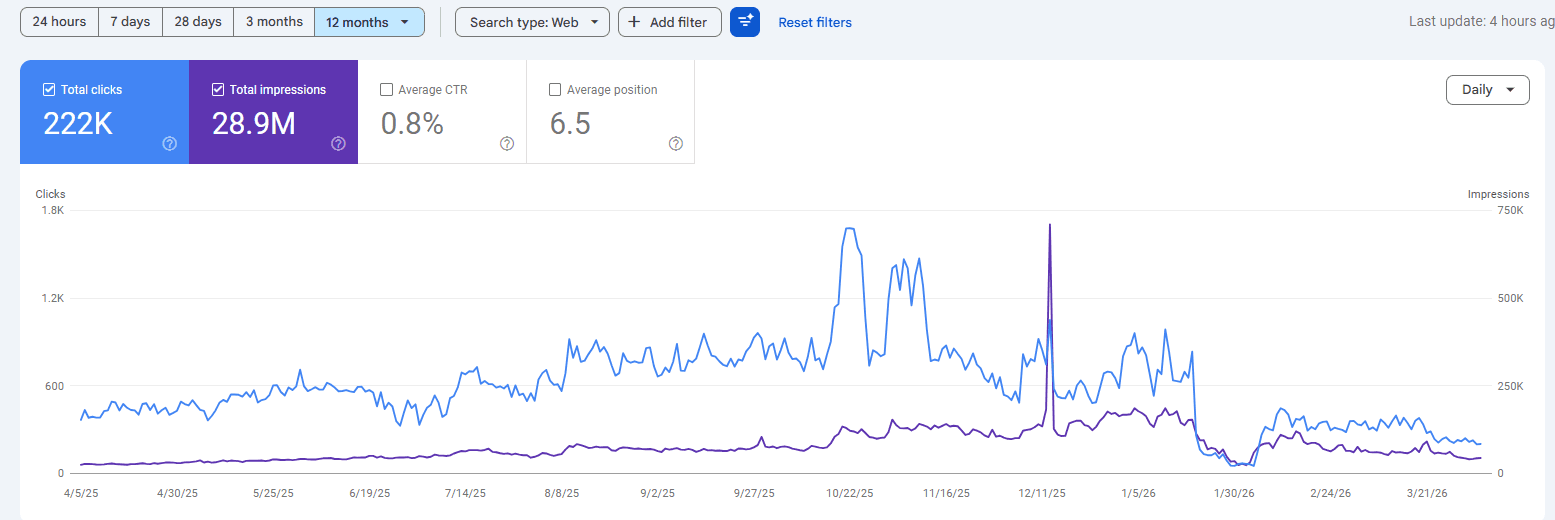
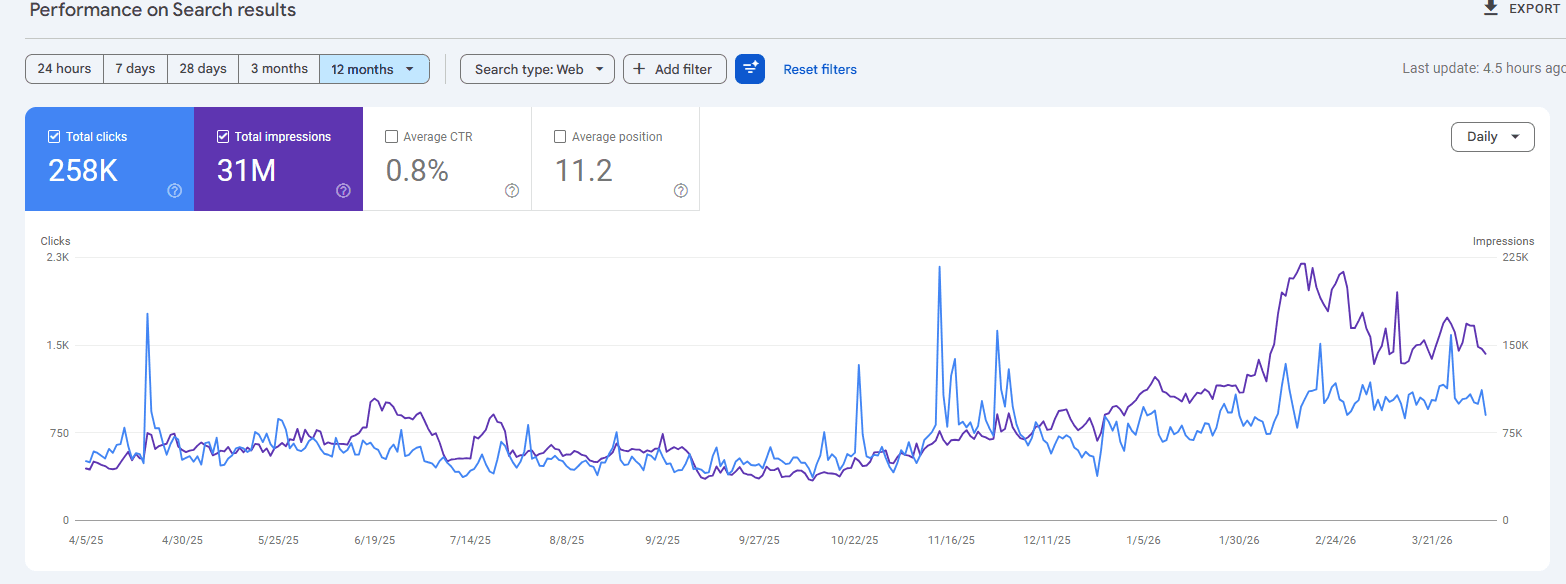
G | 258K | 31M | 0.8% | Two distinct impression inflation waves: ~Nov 2025 and Feb-Mar 2026. Clicks in tight band. |
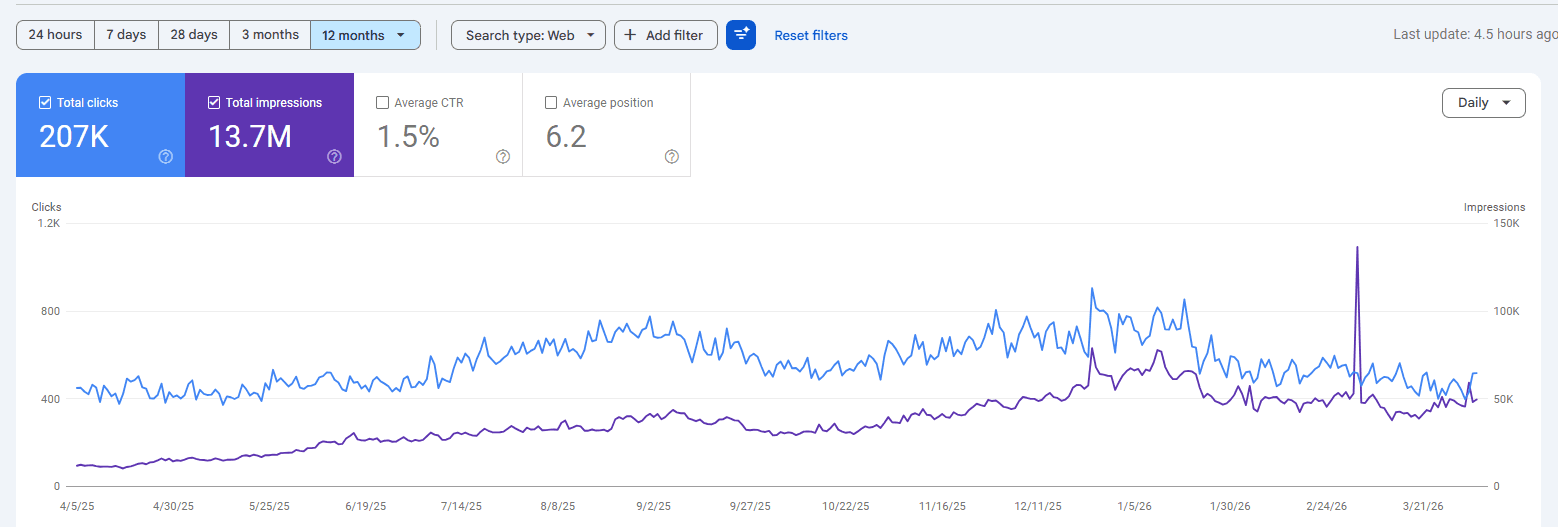
H | 207K | 13.7M | 1.5% | Clean growth until ~Jan 2026, then impressions accelerate while clicks plateau. |
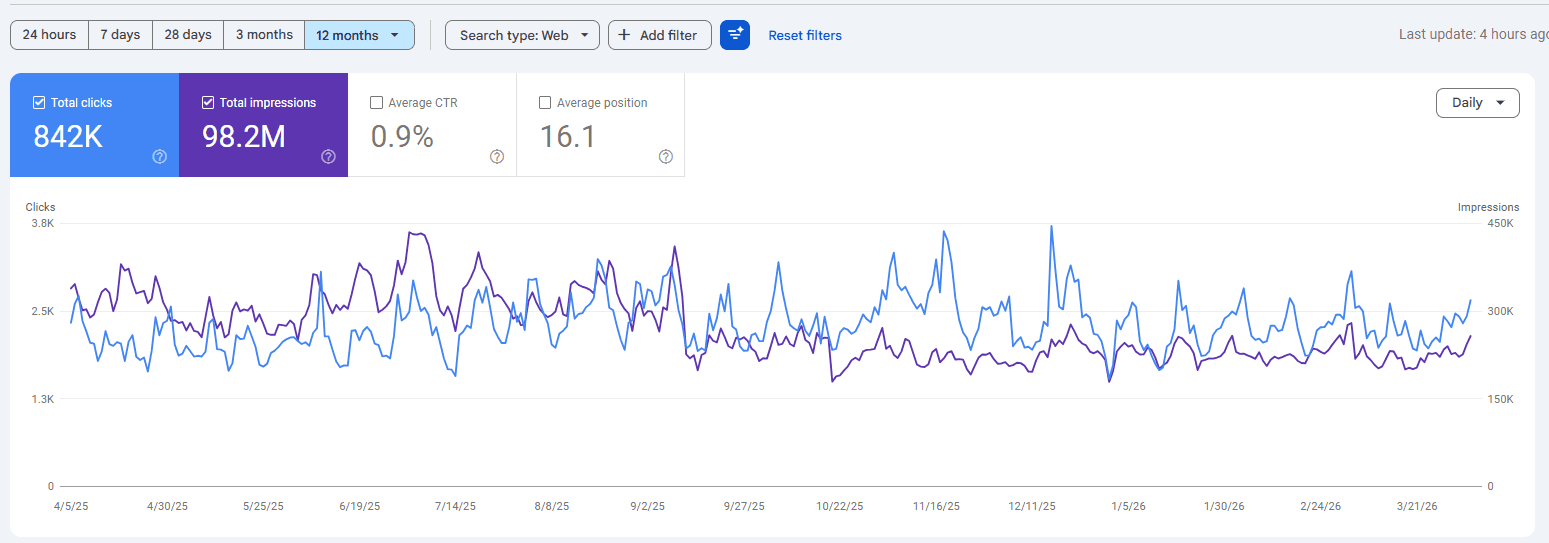
I | 842K | 98.2M | 0.9% | Highly volatile impressions with massive spikes. Clicks relatively stable. |
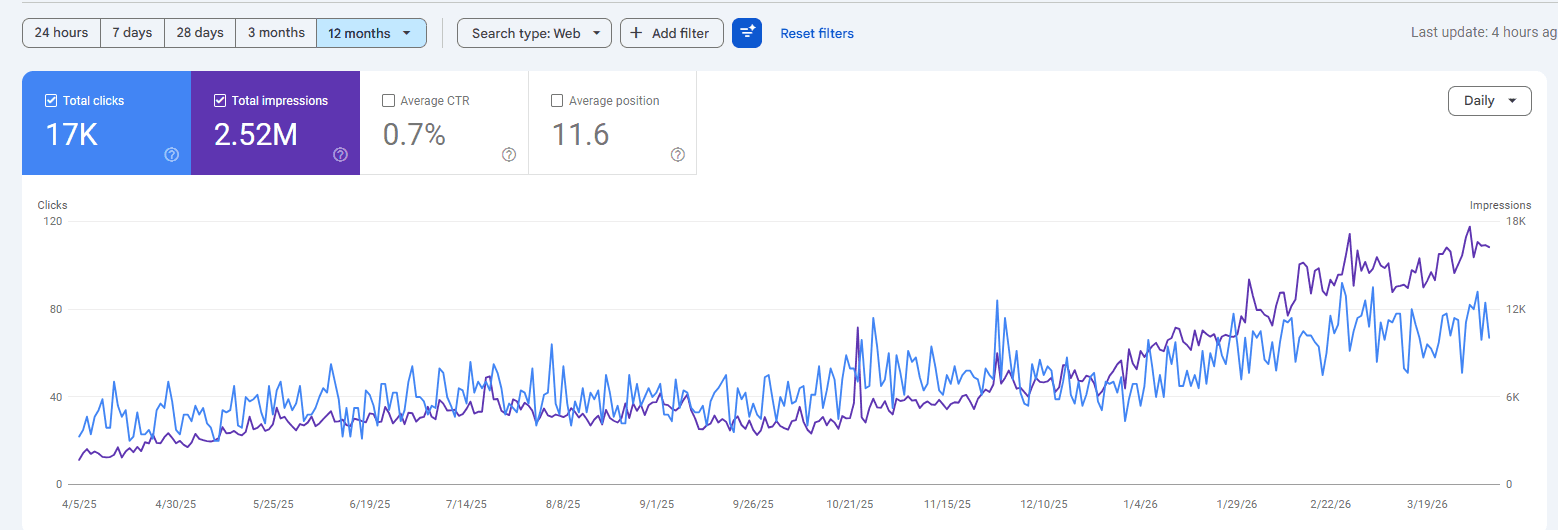
J | 17K | 2.52M | 0.7% | Slow-build inflation from ~Aug 2025. Clicks grow but at slower rate. |
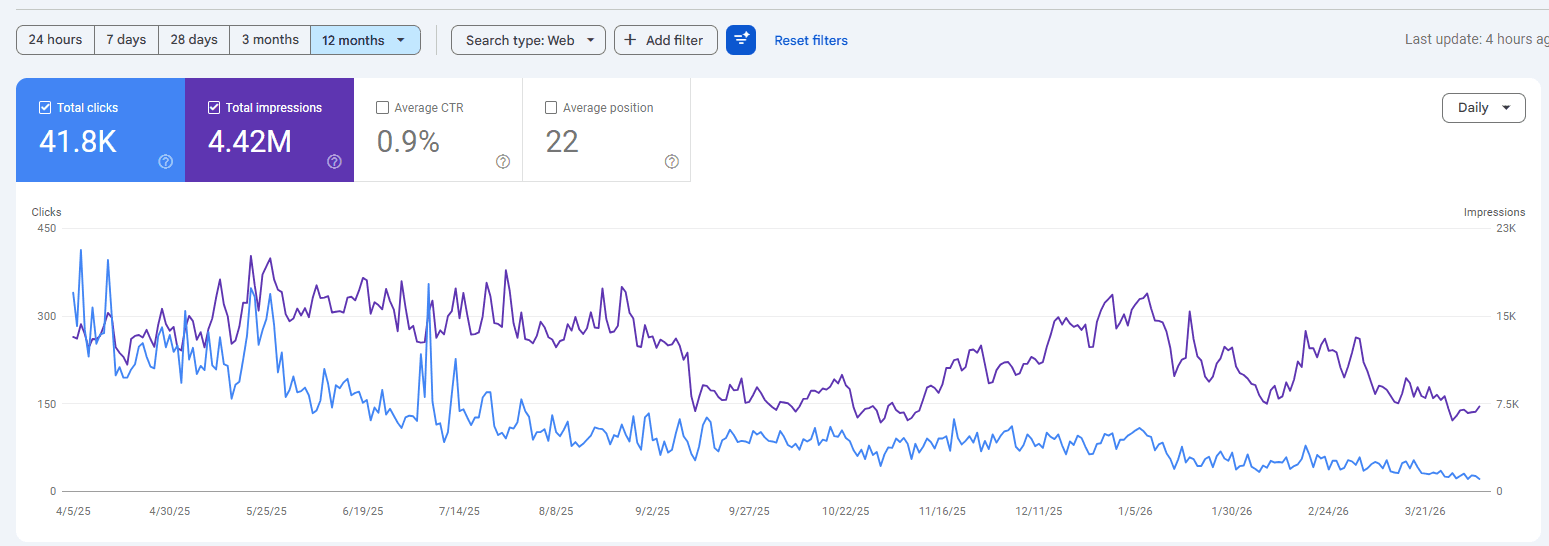
K | 41.8K | 4.42M | 0.9% | Clicks actually decline from ~300/day to ~150/day while impressions hold steady. Inverse pattern. |
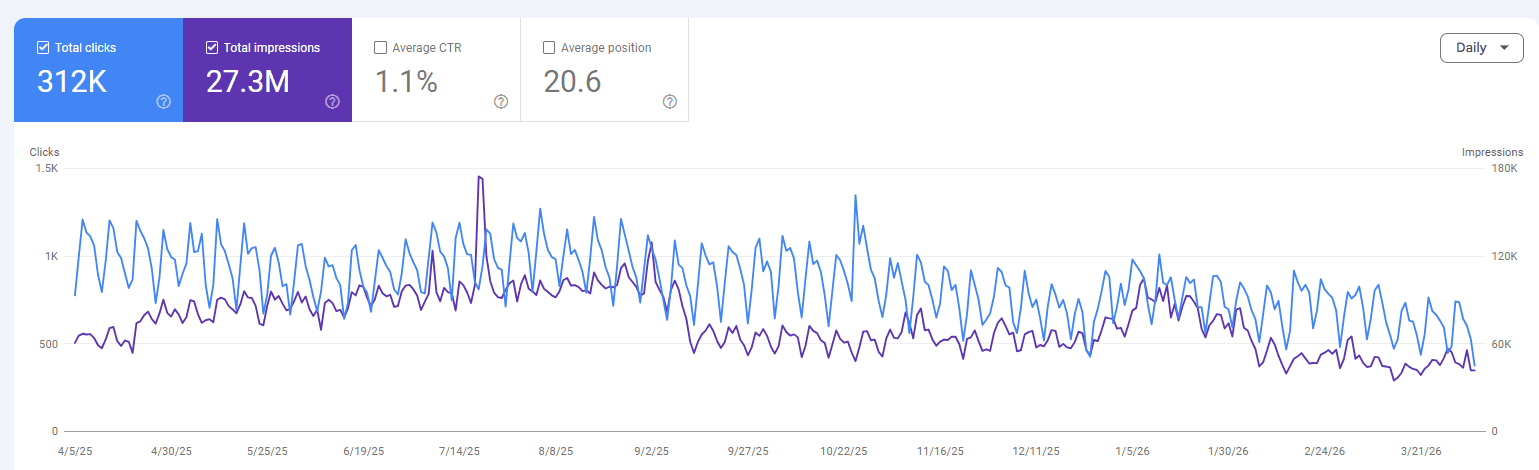
L | 312K | 27.3M | 1.1% | Clearest &num=100 signature: impressions spike to 180K daily Jul-Aug, crash Sep 2025, stay elevated above baseline after. |
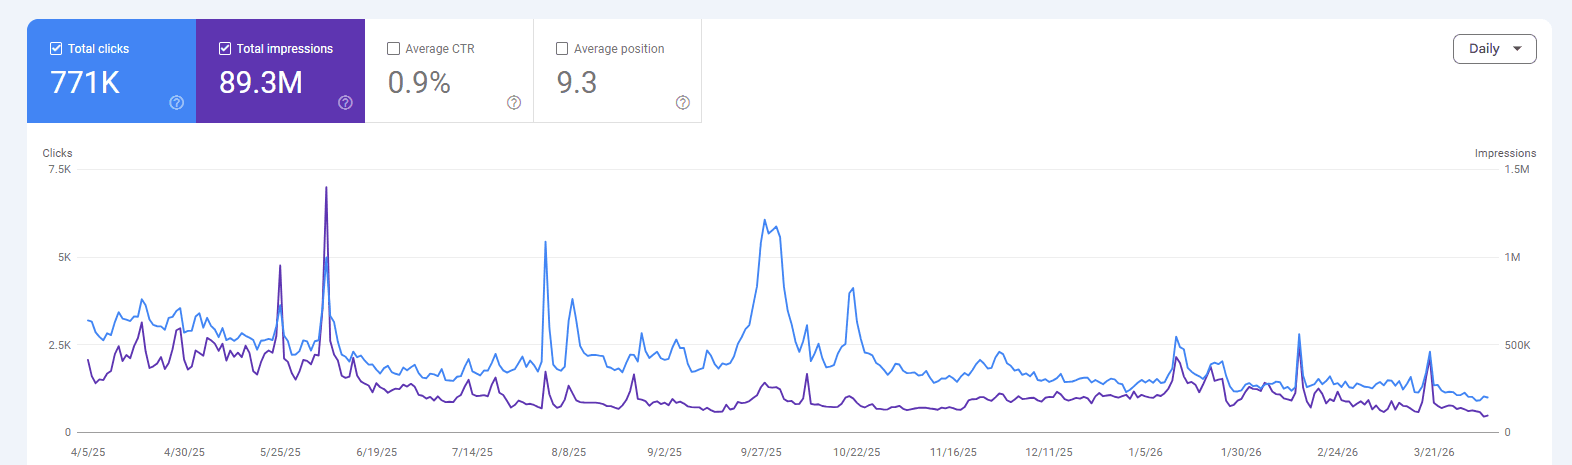
M | 771K | 89.3M | 0.9% | Two massive spikes: Jun 2025 (1.5M daily, clicks follow) and Oct 2025 (1M daily, clicks do not). One real spike, one inflated. |
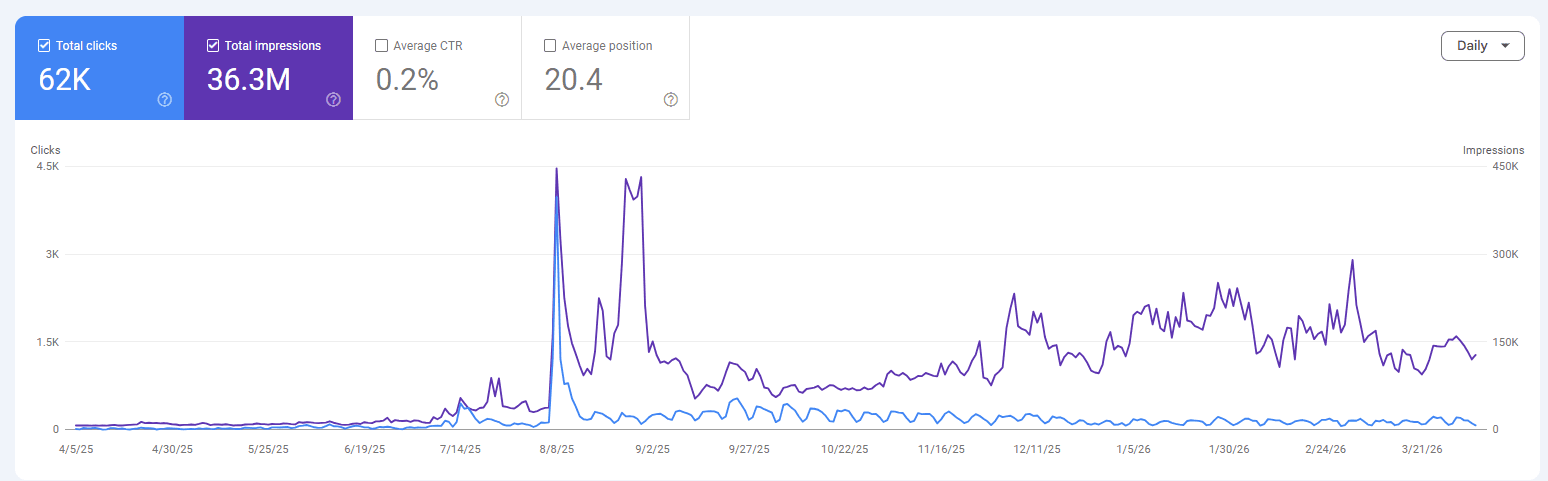
N | 62K | 36.3M | 0.2% | Most extreme inflation in the dataset. Impressions explode ~Aug 2025 to 400K+ daily from near zero. Clicks remain near zero. Almost entirely artificial. |
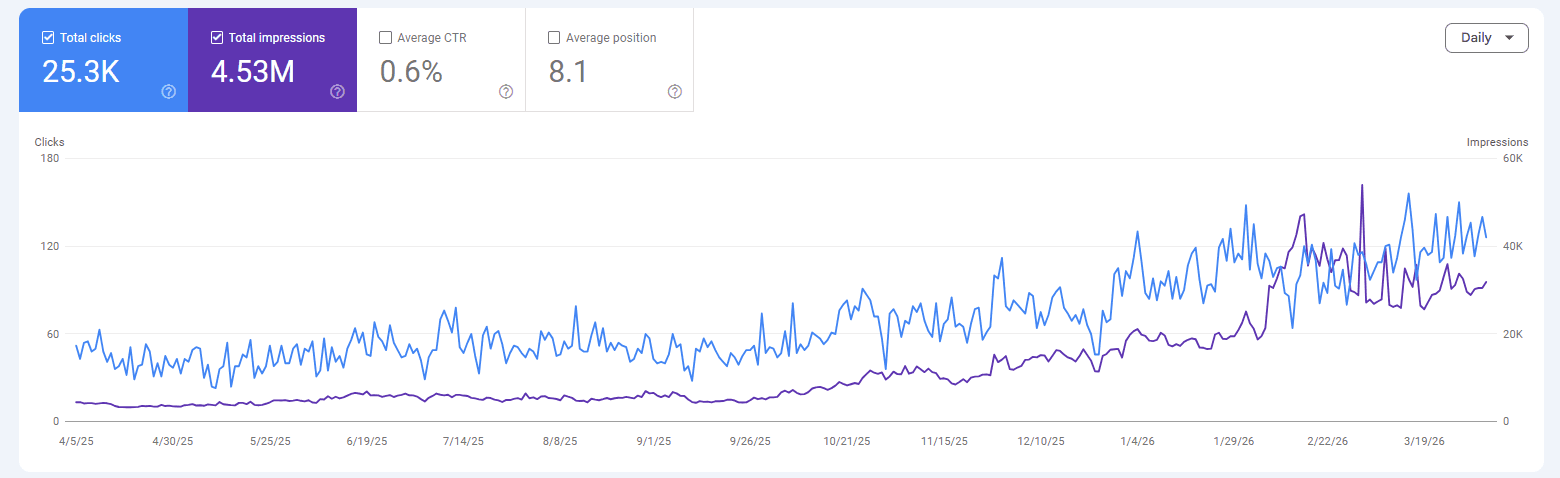
O | 25.3K | 4.53M | 0.6% | Steady impression growth accelerating sharply ~Jan 2026. Clicks grow modestly. Late-period acceleration is inflation. |
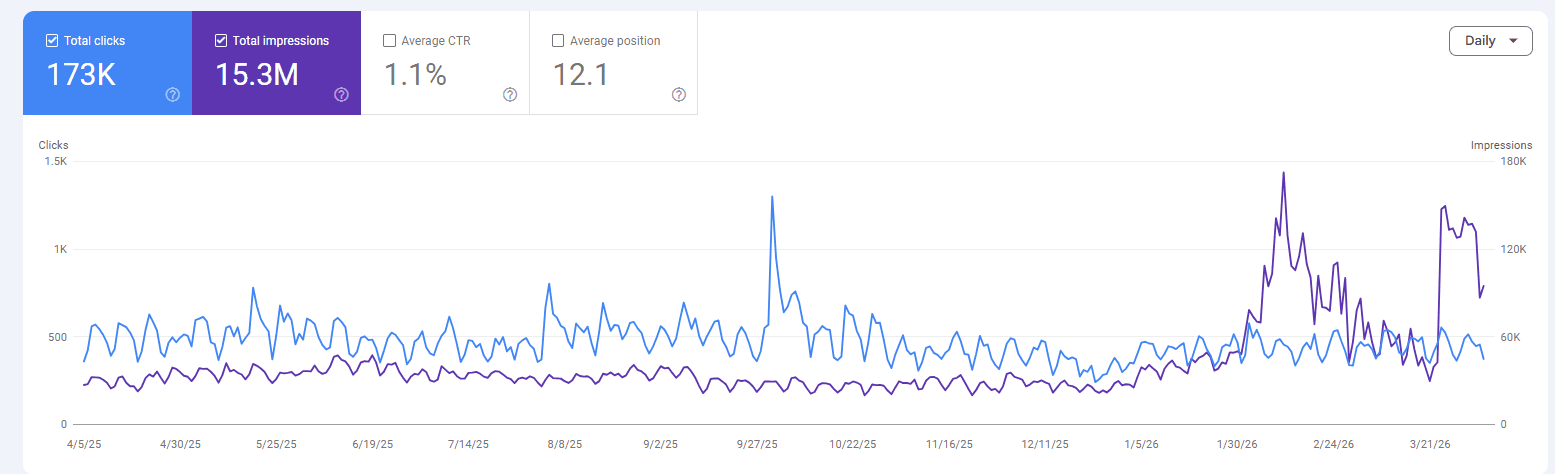
P | 173K | 15.3M | 1.1% | Two distinct inflation waves: ~Sep 2025 spike, drop, then ~Feb-Mar 2026 spike to 180K daily. Clicks stable ~500/day. |
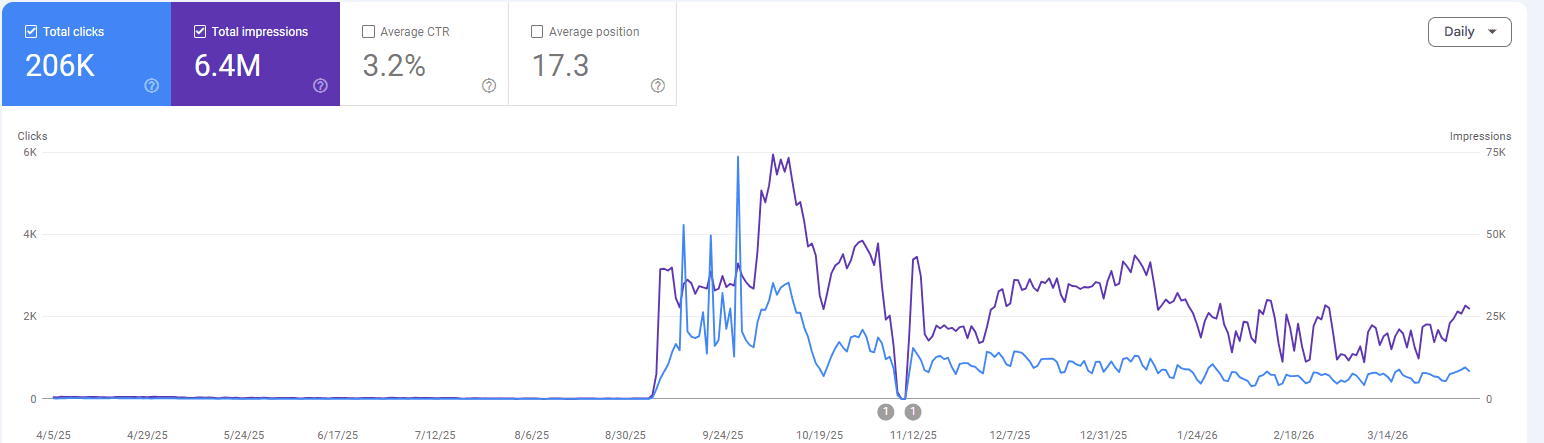
Q | 206K | 6.4M | 3.2% | Genuine growth Aug-Oct 2025 (clicks and impressions rise together). Then divergence: impressions stay elevated, clicks drop back. Inflation layered on top of real gains. |
The combined numbers: Across all 17 properties, total reported impressions were 656 million against 9.5 million clicks, for a blended CTR of 1.4%. If the inflation magnitude is 30-50% (our conservative estimate from the visual evidence), between 150 million and 220 million of those reported impressions were artifacts of the logging bug and scraper inflation. That is 150 to 220 million phantom impressions across just 17 properties.
What this means for you: If you have been reporting impression growth to leadership as evidence of SEO success over the past year, some portion of that growth was a measurement artifact. The clicks tell the true performance story. If your clicks grew, your SEO was working. If your clicks were flat while impressions rose, you were measuring the bug, not your results.
Finding 2: CTR has been artificially depressed across the entire portfolio
CTR is calculated as clicks divided by impressions. When impressions are inflated, CTR is mechanically deflated, even if nothing about your actual content performance changed.
Across our 17 properties, reported CTRs range from 0.2% to 3.2%. The extremes are instructive. Property N reports a 0.2% CTR with 62,000 clicks against 36.3 million impressions. Property Q reports a 3.2% CTR with 206,000 clicks against 6.4 million impressions. Property N's impression data is visually almost entirely artificial (impressions explode from near zero to 400K+ daily while clicks stay near zero). Property Q shows genuine traffic growth but with inflation layered on top from November 2025 onward.
If impressions were inflated by 30-50% across the portfolio (a conservative estimate from the visual patterns), the real CTRs would be 25-50% higher than reported. A page showing 0.4% CTR may have actually been performing at 0.6%. A property showing 0.9% CTR may have been at 1.2-1.4%. These differences change content prioritization decisions.
What this means for you: Review any content decisions made in the past year that were based on CTR analysis. Pages that were deprioritized, rewritten, or defunded because of "declining CTR" may have been victims of the measurement bug, not actual underperformance. Wait for post-fix CTR data before making further optimization decisions based on this metric.
Finding 3: Property N proves impression data can be almost entirely artificial
Property N is the most extreme case in our dataset: 62,000 clicks against 36.3 million impressions over 12 months, producing a reported CTR of 0.2% at an average position of 20.4.
The chart tells the story. From April through July 2025, both clicks and impressions are near zero. In August 2025, impressions explode to over 400,000 per day. Clicks do not follow. They remain near zero. Impressions crash in September 2025 (when the &num=100 parameter was killed), then rebuild to approximately 150,000 per day and stay there. Clicks remain near zero throughout.
This property's impression data is, for practical purposes, fiction. The 36.3 million reported impressions represent almost no real human visibility. If this property's "impression growth" was included in any portfolio-level reporting, it distorted the aggregate numbers.
What this means for you: Not every property is equally affected, but the worst cases are extreme. If you manage a portfolio of properties, check each one individually. A single heavily inflated property can skew your portfolio averages enough to change the narrative.
Finding 4: Property M proves not all impression spikes are fake
Property M (771K clicks, 89.3M impressions) shows two massive impression spikes during the 12-month period. The first, in June 2025, shows both clicks and impressions spiking together to 1.5 million daily impressions and approximately 7,000 daily clicks. The second, in October 2025, shows impressions spiking to approximately 1 million daily with no corresponding click increase.
The first spike was likely genuine: a viral moment, seasonal traffic, or campaign launch where real users drove real impressions and real clicks. The second spike was inflation: impressions rose alone, clicks stayed flat.
This is important because it means you cannot automatically dismiss all impression spikes as the bug. You have to check whether clicks followed. If they did, the spike is likely real. If they did not, it is likely inflation. The bug did not replace all signal with noise. It added noise on top of signal, making them impossible to separate without checking click data.
What this means for you: When reviewing your own GSC data for the past year, compare impression movements against click movements at the same time scale. Where they move together, the data is likely real. Where impressions spike alone, treat that data with extreme skepticism.
Finding 5: Property L shows the clearest &num=100 scraper signature
Property L (312K clicks, 27.3M impressions) displays the most textbook example of the &num=100 scraper inflation and its removal. Impressions spike to approximately 180,000 per day during July and August 2025, then crash sharply in September when Google killed the parameter. After the crash, impressions stabilize at a level that is still elevated above the pre-May 2025 baseline.
That post-September elevation is the logging bug. The scraper inflation was removed, but the underlying logging error continued inflating impressions at a lower rate. This property is the clearest visual proof that the two inflations were overlapping: scrapers were adding one layer of false impressions from above, and the logging bug was adding another layer from below. When the scrapers were removed, the logging bug became the floor rather than the ceiling.
What this means for you: If your properties showed an impression drop in September 2025 that you attributed to the &num=100 change, the level they dropped to was not the true baseline. It was still inflated by the logging bug. The real baseline will only become visible once the April 2026 fix has fully propagated.
What Google Said vs. What the Data Shows
Google's statement | What our data shows | |
|---|---|---|
Scope | "A logging error" (singular) | At least three overlapping data integrity issues affecting the same time period |
Duration | "From May 13, 2025 onward" | Confirmed by our data: inflation patterns begin appearing in the May-June 2025 timeframe across all 10 properties |
Metrics affected | "Clicks and other metrics were not affected" | Click data appears stable across all properties, consistent with Google's statement. However, every metric derived from impressions (CTR, impression-based share of voice, visibility scores) was affected. |
Magnitude | Not disclosed | Varies by property. Across 17 properties, conservative estimate: 30-50% impression inflation on most properties, with extremes like Property N showing near-total artificial data (0.2% CTR, impressions 580x clicks). |
Mechanism | "Logging error" (no further detail) | The pattern of desktop-heavy inflation, eCommerce surface concentration, and timing alignment with scraper tool migrations suggests the logging error may have been exacerbated by external factors including bot traffic and AI system queries. |
The Downstream Impact: What Decisions Were Made on Bad Data
The inflation is not just a reporting nuisance. It flows into every analysis that uses Search Console impressions as an input.
Board and leadership reporting
Impression growth is one of the most commonly reported SEO KPIs to leadership. A chart showing "impressions up 40% year over year" looks like SEO success. If 20 points of that 40% growth were the bug, the real growth was 20%. The narrative changes from "strong momentum" to "modest progress." For properties where the inflation was more extreme, the reported growth may have been entirely artificial.
How many CMOs presented impression growth to their boards during this period? How many SEO budgets were justified on the basis of impression-derived visibility metrics? Those numbers were wrong.
Content prioritization decisions
CTR is used as a content quality signal. Pages with declining CTR get flagged for rewriting, consolidation, or deprioritization. But if CTR declined because the impression denominator was inflated (not because click-through behavior changed), those pages were penalized for a measurement error.
Across our 10 properties, CTR ranged from 0.4% to 2.1% during the bug period. If impressions were inflated by 30-50%, the real CTRs were 25-50% higher than reported. Pages showing 0.4% CTR may have actually been performing at 0.5-0.6%. That is the difference between "underperforming, needs rewrite" and "performing within normal range."
The "AI Overviews are eating our clicks" narrative
From mid-2025 onward, the SEO industry observed a pattern: impressions were rising but clicks were not following. The dominant interpretation was that AI Overviews were satisfying user intent directly, reducing click-through rates. Studies were published. Strategies were revised. Budgets were shifted.
The &num=100 scraper kill in September 2025 revealed that a significant portion of the "rising impressions" were bot-driven. The logging bug acknowledgment in April 2026 reveals that another portion was a system error. The extent to which the "AI Overviews are suppressing clicks" narrative was based on corrupted impression data versus genuine behavioral shifts is now impossible to determine with certainty.
This does not mean AI Overviews have no impact on click behavior. They likely do. But the magnitude of that impact has been measured using an inflated denominator for the past year. The real CTR decline attributable to AI Overviews may be significantly smaller than the industry believed.
AI visibility benchmarking
Our previous research (The AI Visibility Measurement Crisis, Passionfruit Labs, April 2026) documented the unreliability of AI citation metrics across ChatGPT, Perplexity, and other platforms. A common approach in the industry has been to compare "traditional SEO performance" (measured via Search Console) against "AI citation performance" (measured via tracking tools) to assess the relative value of each channel.
If the traditional SEO baseline was inflated by a measurement bug, those comparisons were distorted. A brand that appeared to have "growing traditional visibility but declining AI visibility" may have actually had flat traditional visibility and declining AI visibility, or stable visibility in both channels. The bug undermines every cross-channel comparison that used Search Console impressions as the traditional baseline.
What Clicks Tell You That Impressions Cannot
Across all 17 properties, click data remained stable and consistent with the patterns you would expect from genuine organic growth or normal fluctuation. This is consistent with Google's confirmation that clicks were not affected.
Clicks are the only trustworthy metric in Search Console for the May 2025 to April 2026 period. Everything derived from impressions is suspect.
Here is what you can and cannot trust from the past year of data:
Trustworthy (click-based):
Total organic clicks and click growth rate
Clicks per page (for identifying top-performing content)
Click trends by device, country, and query
Any KPI derived from clicks and independently verified in GA4 (sessions, conversions, revenue from organic)
Not trustworthy (impression-derived):
Total impressions and impression growth rate
Click-through rate (denominator was inflated)
Impression-based share of voice or visibility scores
Average position (influenced by which impressions are recorded)
Any trend analysis comparing pre-May 2025 impressions to post-May 2025 impressions
Year-over-year impression comparisons spanning the bug period
Directional only (use with extreme caution):
Relative impression trends between pages on the same property (the bug likely inflated all pages similarly, so relative comparisons may still hold)
Query-level impression data for identifying new ranking opportunities (the queries are real even if the impression counts are inflated)
Device-level comparisons (desktop was more heavily affected by scrapers, so desktop-vs-mobile impression ratios are skewed)
The Measurement Framework That Works
Based on our analysis of 17 properties and the three overlapping data issues documented above, here is the measurement approach we recommend during and after the correction period.
Immediate actions (this month)
Annotate the bug period. In every reporting dashboard, add annotations at May 13, 2025 (bug begins), June 17, 2025 (AI Mode merged), September 12, 2025 (&num=100 killed), and April 3, 2026 (fix begins). This prevents anyone from interpreting impression changes during this period as performance changes.
Capture your current baselines. Export daily data from every GSC property now, before the fix fully propagates. You will need pre-fix and post-fix data to calculate the actual inflation magnitude for each property. This data will never be available again once impressions stabilize.
Switch your primary KPI to clicks. If your leadership reporting currently features impressions or CTR as primary metrics, replace them with total clicks and click growth rate until the fix is complete and you have established a clean baseline.
Communicate proactively. Tell your leadership team, your board, and your clients about the bug before they notice the impression drop and assume it means SEO performance declined. Use Google's own statement as the source. The impression decrease is a correction, not a decline.
Short-term actions (next 60 days)
Calculate your property-specific inflation. Once the fix has fully rolled out (Google estimates several weeks), compare post-fix daily impressions to the April 1-May 12, 2025 baseline (the last clean period). The percentage difference is your property-specific inflation estimate.
Recalculate CTR for the bug period. Using the inflation estimate, adjust the impression denominator retroactively to produce corrected CTR figures. Compare these corrected CTRs to any content prioritization decisions made during the bug period. Identify pages that may have been incorrectly deprioritized.
Audit your GA4 cross-references. For every property, compare GSC click trends to GA4 organic session trends for the same period. If they align (they should, since clicks were unaffected), you have independent confirmation that organic performance was stable. If they diverge, investigate other factors.
Long-term actions (next 6-12 months)
Build a multi-signal measurement framework. Search Console impressions should no longer be treated as a primary SEO KPI. They are a useful directional signal, but the past year has demonstrated that they are vulnerable to logging errors, scraper inflation, and unsegmented data merges. A resilient measurement framework includes:
Signal | Source | What it measures | Reliability |
|---|---|---|---|
Organic clicks | GSC | Actual user acquisition from search | High (confirmed unaffected) |
Organic sessions | GA4 | Site-level traffic from search | High (independent source) |
Conversions from organic | GA4 | Business impact | High |
Click growth rate | GSC | Trend direction | High |
Impressions | GSC | Directional visibility signal | Low (subject to logging errors, bot inflation, unsegmented AI Mode data) |
CTR | GSC | Content engagement signal | Low (derived from unreliable impressions) |
Average position | GSC | Ranking proxy | Medium (distorted by AI Mode position calculation differences) |
AI visibility metrics | Multi-platform tracking | Brand presence in AI responses | Low-medium (see companion research) |
Separate AI Mode data when segmentation becomes available. Google has not announced a timeline for an AI Mode filter in Search Console. When it arrives, immediately begin tracking AI Mode impressions and clicks separately to understand their contribution to your totals.
Establish a new clean baseline. Once the fix is complete and impressions have stabilized (likely May-June 2026), establish that period as your new baseline. Year-over-year comparisons will only be meaningful starting from this new baseline compared to one year later (May-June 2027).
Research Methods
Data sources
Primary data: 12 months of Google Search Console Performance report data across 17 properties spanning B2B SaaS, eCommerce, media, and professional services, captured in early April 2026 via the Search Console web interface. All properties use the "Web" search type filter with daily granularity.
Supporting sources: Google's official Data Anomalies page (updated April 3, 2026), Search Engine Land reporting (Danny Goodwin, April 3, 2026), Brodie Clark's independent analysis (LinkedIn and X, March 30 and April 3, 2026), Search Engine Roundtable coverage, Opascope portfolio analysis (November 2025), and practitioner reports from the &num=100 deprecation period (September-December 2025).
Limitations
The 17 properties analyzed span B2B SaaS, eCommerce, media, and professional services, but do not represent all industries equally. Property-level inflation estimates are based on visual analysis of pre-fix data; precise quantification requires post-fix data that is not yet available. The distinction between inflation caused by the logging bug versus inflation caused by scrapers versus inflation caused by AI Mode data merging cannot be cleanly separated at the property level. Google has not disclosed the technical mechanism of the logging error, which limits our ability to model its behavior.
About this research
This study was produced by Passionfruit Labs. Passionfruit is a B2B SEO, GEO, and AI visibility agency. We manage Search Console data for our clients as part of our service offering. It is in our financial interest to position ourselves as experts in SEO data quality and measurement methodology.
We disclose this because the research demands it. Google's official statement and the Data Anomalies page are publicly accessible. Every supporting source is cited. We encourage independent replication using your own Search Console data.
Key Sources
Google (Apr 3, 2026). Data Anomalies in Search Console. Official support page.
Goodwin, D. (Apr 3, 2026). Google is fixing a Search Console bug that inflated impression counts. Search Engine Land.
PPC.land (Apr 4, 2026). Google Search Console impressions bug ran for nearly a year unnoticed.
Clark, B. (Mar 30, 2026). GSC merchant listings and Google Images impression anomalies. LinkedIn.
Clark, B. (Apr 3, 2026). Confirmation of Google's Data Anomalies update. X.
Gabe, G. (Jun 2025). How Google's AI Mode is tracked in Google Search Console. G-Squared Interactive.
Stox, P. (Jun 12, 2025). Confirmation of AI Mode click tracking in GSC. X.
Search Engine Land (Oct 2025). Why Google Search Console impressions fell (and why that's good).
Opascope (Nov 2025). Google Search Console impression drop Sept 2025: Here's what you can still rely on.
Google (Jun 17, 2025). AI Mode data integration with Search Console. Updated help documentation.
Passionfruit Labs (Apr 2026). The AI Visibility Measurement Crisis. Companion research.
What To Do Next
1. Run the 5-minute GSC health check
Open each of your Search Console properties. Set the date range to 12 months. Look at the impression line (purple) versus the click line (blue). If impressions grew significantly while clicks stayed flat, your data was inflated. The wider the gap, the larger the inflation.
Then check by device. Filter to desktop only. If the impression spike is concentrated on desktop (which our data and industry reports suggest is common), you now know the inflation was at least partially driven by scraper activity in addition to the logging bug.
2. Get a Passionfruit GSC data audit
We are offering a complimentary GSC data integrity audit during the correction period. The audit includes:
Property-by-property inflation estimate based on pre-bug baseline comparison
Corrected CTR calculations for the bug period to identify pages that may have been incorrectly deprioritized
Click-based performance assessment showing your actual organic trajectory over the past year
Annotated timeline visualization for your leadership team with all five data discontinuities marked
Recommendations for rebuilding your measurement framework with click-based primary KPIs
This audit is particularly valuable if you need to re-brief leadership or a board on SEO performance after the impression correction causes a visible drop in your dashboards. We provide the context and the corrected narrative so the drop is understood as a data quality improvement, not a performance decline.
3. Read the companion research
This study is the second in a series from Passionfruit Labs on the measurement crisis affecting organic and AI search:
Study 1: The AI Visibility Measurement Crisis examines why AI citation metrics are unreliable. SparkToro proved brand recommendation lists are random. Seer Interactive proved citations and recommendations are decoupled. AirOps proved 85% of retrieved content is never cited. Together, these findings show that AI visibility tools are measuring noise.
This study (Study 2) shows that the traditional SEO metrics being compared against AI metrics were also corrupted. The entire measurement infrastructure, both traditional and AI, needs rebuilding.
Study 3 (forthcoming): The Post-Fix Baseline. Once Google's correction has fully propagated, we will publish follow-up data from the same 17 properties showing the actual inflation magnitude, corrected CTRs, and the new measurement baselines. Subscribe to Passionfruit Labs to receive it.
Passionfruit Labs | April 2026
This research was written by [Your Name], [Your Title] at Passionfruit. For questions, corrections, or to discuss your GSC data quality, reach us at getpassionfruit.com/contact-us.
If your reporting dashboards are about to show an impression drop and you need to explain it to leadership before they panic, share this study. It contains the context, the data, and the corrected framework in one place.


